Metrics
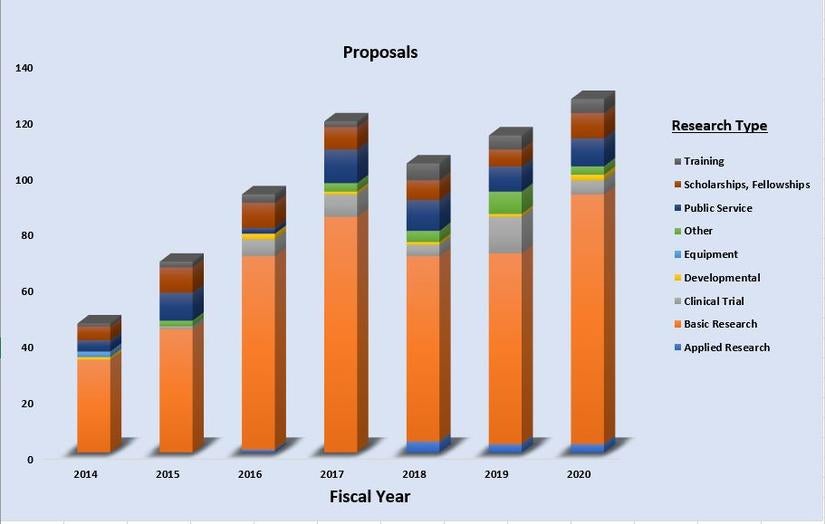
Number of Proposals by Sponsor Category
Note: FY2017 captured year-to-date
Sponsor Code Categories
US Federal Government
Departments and agencies of the United States federal government. All US Federal Government sponsor codes are assigned to a "type" attribute that is generally analogous to a cabinet level department. Some codes are assigned a "sub type" attribute that further distinguishes a code in large, complex organizations.
Examples
- The Library of Congress
- National Science Foundation
State of California Government
Departments, agencies and commissions of the State of California. State of California sponsor codes are further distinguished with a "type" and "sub type" indicator.
Examples
- California Department of Child Support Services
- California Energy Commission
Other, Inter, or Non-Governmental Organization
Other governmental agencies, including: cities; counties; other states; foreign governments or governmental agencies; multi-national organizations such as the United Nations; or, quasi-governmental agencies or special districts, such as a water or pest control district. These sponsor codes are further distinguished with the "type" indicator.
Examples
- City of Sacramento
- United Nations
- Marin Municipal Water District
Agriculture Marketing Boards
Entities established by the California Department of Food and Agriculture or the United States Department of Agriculture to market and promote the activities of specific agriculture commodity groups.
Examples
- California Dry Bean Advisory Board
- California Walnut Board
Business/For-Profit Entity
The "Type" indicator is used to distinguish the legal structure of the entity.
Examples
- Black & Decker
- TELOS Pharmaceuticals, LLC
Business Related/Interest Group
Nonprofit organization sponsored by one or more business or other entities engaged in activities for profit, including: corporate foundations, industry or trade associations; and professional, union, or lobbying organizations. For US Nonprofits, any organization not defined as 501(c)(3).
Examples
- Wool Research Organization of New Zealand
- Brain Mapping Medical Research Organization
Foundation/Charitable Trust
Non-profit foundations or charitable trusts, as defined in The Foundation Directory excluding corporate foundations, and including funds or endowments designated by the Internal Revenue Service as private grant-making foundations, community foundations, family foundations, and charitable trusts. New codes are not assigned to this category; previously created codes remain assigned to this category.
Examples
- Geraldine R. Dodge Foundation
- Deer Creek Foundation
Charitable Organization
All new sponsor codes for charitable organizations are assigned to this category, unless the entity is found to be Business Related/Interest Group. For US Nonprofits, any organization defined at 501 (c)(3) by the IRS falls under this category. For non-profit entities outside of the US, a sponsor code will generally be linked to this category.
Examples
- North County Health Services
- Bill & Melinda Gates Foundation
Higher Education
The "Type" indicator is used to distinguish among government-controlled (i.e."public"), non-profit (i.e "private”), and for-profit institutions of higher education. The California State University and, where applicable, its campus specific auxiliaries/foundations are tracked in location-specific merged sponsor codes (e.g. CSU San Marcus and its auxiliary share the same sponsor code). UC campuses are excluded and are tracked in their own category.
Examples
- Kumamoto University
- Lehigh University
UC Campus, Location, or Program
UC campuses, other UC locations (e.g. Scripps) and internal UC programs that are either campus-based or have a systemwide mission. Other than the sponsor codes defining a specific UC campus or location, each program should be linked with a UC campus or location as its parent sponsor code. RPAC limits the creation of new sponsor codes below the campus level.
Examples
- UC Santa Barbara
- UC Energy Institute
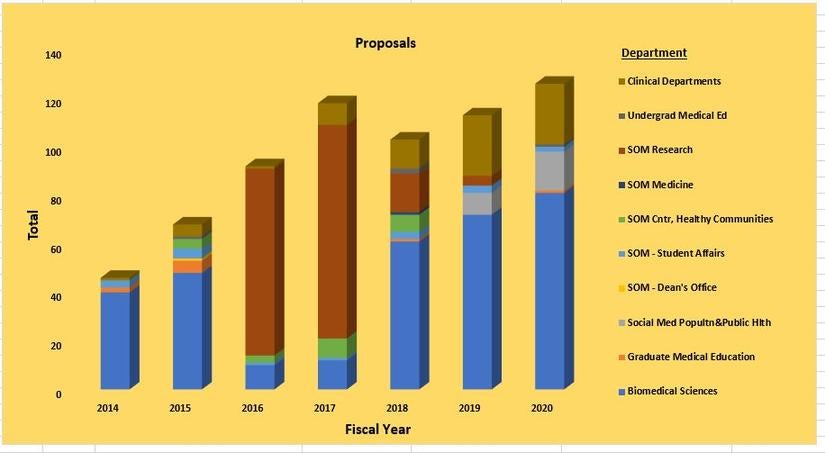
Number of Proposals by Unit
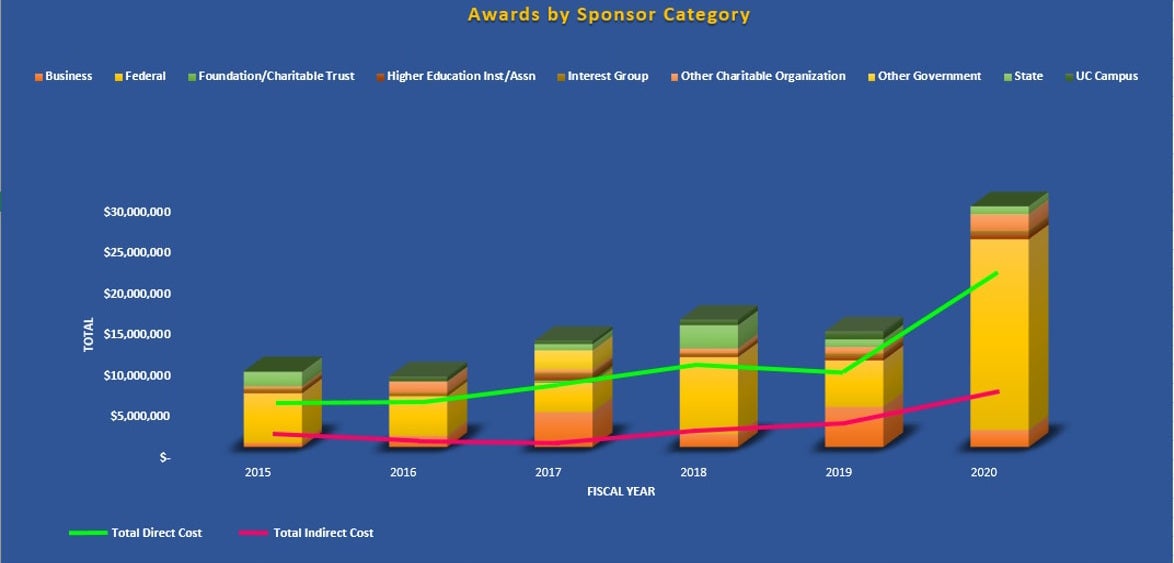
Annual Awards Received by Sponsor Category
Annual Awards by Sponsor Category Data
| Fiscal Year | Business | Federal | Foundation/Charitable Trust | Higher Education Inst./Assn. | Interest Group | Other Charitable Organization | Other Government | State | UC Campus | Grand Total |
|---|---|---|---|---|---|---|---|---|---|---|
| 2015 | $539,927 | $6,022,547 | - | $262,768 | $272,909 | $299,848 | - | $1,758,075 | $91,200 | $9,247,274 |
| 2016 | $1,395,495 | $4,818,822 | - | $90,618 | $315,768 | $1,388,099 | $900 | - | $602,075 | $8,611,777 |
| 2017 | $4,254,291 | $3,566,834 | $300,000 | $612,029 | $296,070 | $411,038 | $2,350,637 | $760,447 | $404,750 | $12,956,096 |
| 2018 | $1,602,986 | $9,367,125 | - | $280,542 | $167,547 | $590,414 | ($49,294) | $2,832,431 | $683,385 | $15,475,136 |
| 2019 | $4,899,381 | $5,665,186 | - | $502,226 | $316,378 | $808,253 | - | $926,666 | $1,003,723 | $14,123,813 |
| 2020 | $2,092,575 | $23,215,147 | - | $700,112 | $302,855 | $2,013,821 | $47,500 | $949,571 | - | $29,321,581 |
| Grand Total | $14,784,655 | $52,655,661 | $300,000 | $2,448,295 | $1,671,527 | $5,511,473 | $2,349,743 | $7,229,190 | $2,785,133 | $89,735,677 |
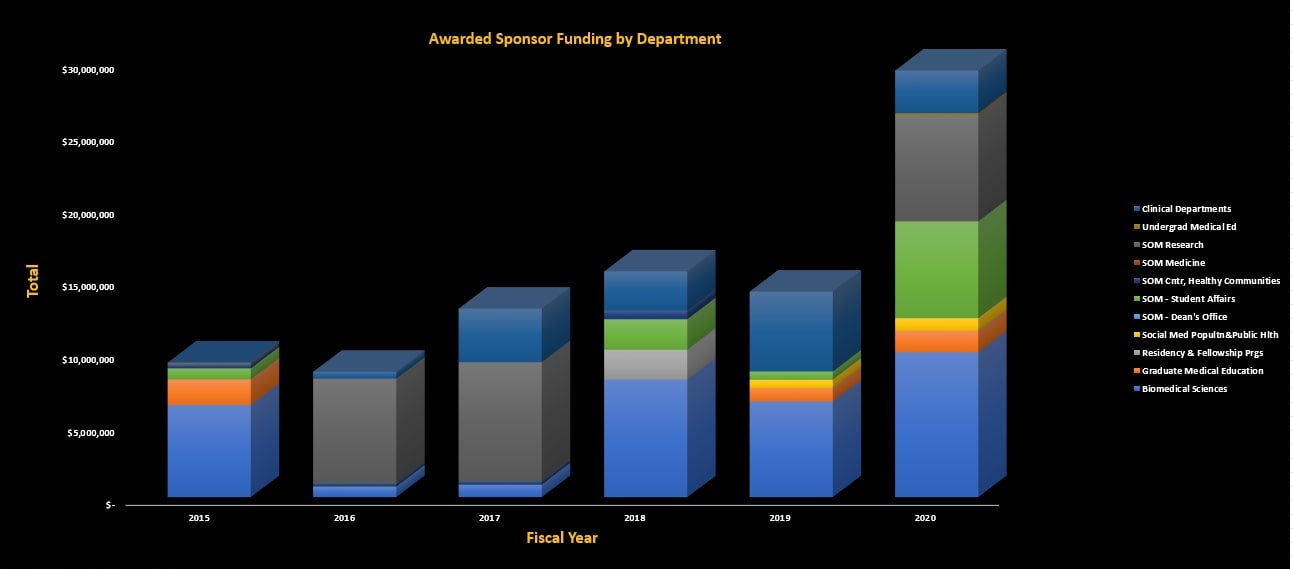
Annual Sponsor Funding by Department
Awarded Sponsor Funding by Department Data
| Year | Biomedical Sciences | Graduate Medical Education | Residency & Fellowship Programs | Social Med., Population, and Public Health | SOM Dean's Office | SOM Student Affairs | Healthy Communities | SOM Medicine | SOM Research | Undergraduate Medical Education | Clinical Departments | Grand Total |
|---|---|---|---|---|---|---|---|---|---|---|---|---|
| 2015 | $6,335,396 | $1,758,075 | - | - | - | $753,081 | $249,989 | - | $150,733 | - | - | $9.247,274 |
| 2016 | $686,756 | - | - | - | - | $33,012 | $249,380 | - | $7,172,014 | - | $470,615 | $8,611,777 |
| 2017 | $841,915 | - | $11,500 | - | - | - | $249,986 | - | $8,164,726 | - | $3,687,969 | $12,956,096 |
| 2018 | $8,073,521 | - | $2,056,575 | - | - | $2,095,272 | $604,880 | - | ($37,164) | - | $2,682,052 | $15,475,136 |
| 2019 | $6,580,702 | $916,666 | - | $572,772 | - | $562,000 | - | - | $540 | - | $5,491,133 | $14,123,813 |
| 2020 | $9,961,063 | $1,485,000 | - | $851,098 | - | $6,653,828 | - | - | $7,303,393 | $118,686 | $2,948,513 | $29,321,581 |
| Grand Totals | $32,479,353 | $4,159,741 | 2,068,075 | $1,423,870 | - | $10,097,193 | $1,354,235 | - | $22,754,242 | $118,686 | $15,280,282 | $89,735,677 |


